
Tableau Certified Consultant - TCC-C01 Exam Practice Test
A consultant migrated a data source to improve performance. The consultant wants to identify which workbooks need to be updated to point to the new data source.
Which Tableau tool should the consultant use?
Which Tableau tool should the consultant use?
Correct Answer: D
Vote an answer
Explanation: Only visible for Fast2test members. You can sign-up / login (it's free).
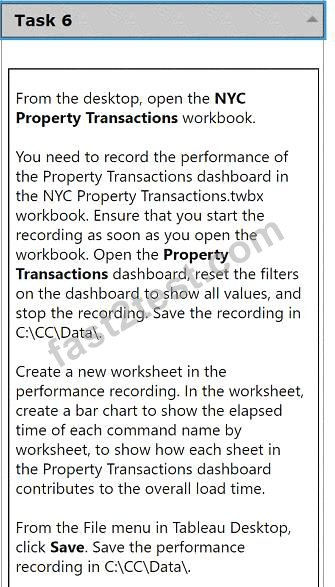
From the desktop, open the NYC
Property Transactions workbook.
You need to record the performance of
the Property Transactions dashboard in
the NYC Property Transactions.twbx
workbook. Ensure that you start the
recording as soon as you open the
workbook. Open the Property
Transactions dashboard, reset the filters
on the dashboard to show all values, and
stop the recording. Save the recording in
C:\CC\Data\.
Create a new worksheet in the
performance recording. In the worksheet,
create a bar chart to show the elapsed
time of each command name by
worksheet, to show how each sheet in
the Property Transactions dashboard
contributes to the overall load time.
From the File menu in Tableau Desktop,
click Save. Save the performance
recording in C:\CC\Data\.
Correct Answer:
See the complete Steps below in Explanation:
Explanation:
To record the performance of the Property Transactions dashboard in the NYC Property Transactions.twbx workbook and analyze it using a bar chart, follow these detailed steps:
* Open the NYC Property Transactions Workbook:
* From the desktop, double-click the NYC Property Transactions.twbx workbook to open it in Tableau Desktop.
* Start Performance Recording:
* Before doing anything else, navigate to the 'Help' menu in Tableau Desktop.
* Select 'Settings and Performance', then choose 'Start Performance Recording'.
* Open the Property Transactions Dashboard and Reset Filters:
* Navigate to the Property Transactions dashboard within the workbook.
* Reset all filters to show all values. This usually involves selecting the dropdown on each filter and choosing 'All' or using a 'Reset' button if available.
* Stop the Performance Recording:
* Go back to the 'Help' menu.
* Choose 'Settings and Performance', then select 'Stop Performance Recording'.
* Tableau will automatically open a new tab displaying the performance recording results.
* Save the Performance Recording:
* In the performance recording results tab, go to the 'File' menu.
* Click 'Save As' and navigate to the C:\CC\Data\ directory.
* Save the file, ensuring it is stored in the desired location.
* Create a New Worksheet for Performance Analysis:
* Return to the NYC Property Transactions workbook and create a new worksheet by clicking on the 'New Worksheet' icon.
* Drag the 'Command Name' field to the Columns shelf.
* Drag the 'Elapsed Time' field to the Rows shelf.
* Ensure that the 'Worksheet' field is also included in the analysis to break down the time by individual sheets within the dashboard.
* Choose 'Bar Chart' from the 'Show Me' options to display the data as a bar chart.
* Customize and Finalize the Bar Chart:
* Adjust the axes and labels to clearly display the information.
* Format the chart to enhance readability, applying color coding or sorting as needed to emphasize sheets with longer load times.
* Save Your Work:
* Once the new worksheet and the performance recording are complete, ensure all work is saved.
* Navigate to the 'File' menu and click 'Save', confirming that changes are stored in the workbook.
References:
* Tableau Help Documentation: Provides guidance on how to start and stop performance recordings and analyze them.
* Tableau Visualization Techniques: Offers tips on creating effective bar charts for performance data.
By following these steps, you have successfully recorded and analyzed the performance of the Property Transactions dashboard, providing valuable insights into how each component of the dashboard contributes to the overall load time. This analysis is crucial for optimizing dashboard performance and ensuring efficient data visualization.
Explanation:
To record the performance of the Property Transactions dashboard in the NYC Property Transactions.twbx workbook and analyze it using a bar chart, follow these detailed steps:
* Open the NYC Property Transactions Workbook:
* From the desktop, double-click the NYC Property Transactions.twbx workbook to open it in Tableau Desktop.
* Start Performance Recording:
* Before doing anything else, navigate to the 'Help' menu in Tableau Desktop.
* Select 'Settings and Performance', then choose 'Start Performance Recording'.
* Open the Property Transactions Dashboard and Reset Filters:
* Navigate to the Property Transactions dashboard within the workbook.
* Reset all filters to show all values. This usually involves selecting the dropdown on each filter and choosing 'All' or using a 'Reset' button if available.
* Stop the Performance Recording:
* Go back to the 'Help' menu.
* Choose 'Settings and Performance', then select 'Stop Performance Recording'.
* Tableau will automatically open a new tab displaying the performance recording results.
* Save the Performance Recording:
* In the performance recording results tab, go to the 'File' menu.
* Click 'Save As' and navigate to the C:\CC\Data\ directory.
* Save the file, ensuring it is stored in the desired location.
* Create a New Worksheet for Performance Analysis:
* Return to the NYC Property Transactions workbook and create a new worksheet by clicking on the 'New Worksheet' icon.
* Drag the 'Command Name' field to the Columns shelf.
* Drag the 'Elapsed Time' field to the Rows shelf.
* Ensure that the 'Worksheet' field is also included in the analysis to break down the time by individual sheets within the dashboard.
* Choose 'Bar Chart' from the 'Show Me' options to display the data as a bar chart.
* Customize and Finalize the Bar Chart:
* Adjust the axes and labels to clearly display the information.
* Format the chart to enhance readability, applying color coding or sorting as needed to emphasize sheets with longer load times.
* Save Your Work:
* Once the new worksheet and the performance recording are complete, ensure all work is saved.
* Navigate to the 'File' menu and click 'Save', confirming that changes are stored in the workbook.
References:
* Tableau Help Documentation: Provides guidance on how to start and stop performance recordings and analyze them.
* Tableau Visualization Techniques: Offers tips on creating effective bar charts for performance data.
By following these steps, you have successfully recorded and analyzed the performance of the Property Transactions dashboard, providing valuable insights into how each component of the dashboard contributes to the overall load time. This analysis is crucial for optimizing dashboard performance and ensuring efficient data visualization.
A consultant creates a histogram that presents the distribution of profits across a client's customers. The labels on the bars show percent shares. The consultant used a quick table calculation to create the labels.
Now, the client wants to limit the view to the bins that have at least a 15% share. The consultant creates a profit filter but it changes the percent labels.
Which approach should the consultant use to produce the desired result?
Now, the client wants to limit the view to the bins that have at least a 15% share. The consultant creates a profit filter but it changes the percent labels.
Which approach should the consultant use to produce the desired result?
Correct Answer: A
Vote an answer
Explanation: Only visible for Fast2test members. You can sign-up / login (it's free).
A client has several long-term shipping contracts with different vendors that set rates based on shipping volume and speed. The client requests a dashboard that allows them to model shipping costs for the next week based on the selected shipping vendor. Speed for the end user is critical.
Which dashboard building strategy will deliver the desired result?
Which dashboard building strategy will deliver the desired result?
Correct Answer: B
Vote an answer
Explanation: Only visible for Fast2test members. You can sign-up / login (it's free).
An executive-level workbook leverages 37 of the 103 fields included in a data source. Performance for the workbook is noticeably slower than other workbooks on the same Tableau Server.
What should the consultant do to improve performance of this workbook while following best practice?
What should the consultant do to improve performance of this workbook while following best practice?
Correct Answer: C
Vote an answer
Explanation: Only visible for Fast2test members. You can sign-up / login (it's free).
A consultant plans a Tableau deployment for a client that uses Salesforce. The client wants users to automatically see Tableau views of regional sales filtered by customer as soon as the users sign into Salesforce.
Which approach should the consultant use to deliver the final visualization?
Which approach should the consultant use to deliver the final visualization?
Correct Answer: A
Vote an answer
Explanation: Only visible for Fast2test members. You can sign-up / login (it's free).